
Quantitative Analysis of Oat (Avena sativa L.) and Pea (Pisum sativum L.) Saponins in Plant-Based Food Products by Hydrophilic Interaction Liquid Chromatography Coupled with Mass Spectrometry

 , , ,
, , ,
Abstract
:
1. Introduction
2. Materials and Methods
2.1. Chemicals and Materials
2.2. Food Samples
2.3. Extraction Method for Solid Samples and for Liquid Samples
2.4. Preparation of Standard Solutions
2.5. Liquid Chromatography Mass Spectrometry
2.6. Calibration and Quantification
2.7. Validation of the Method
3. Results and Discussion
3.1. Development of Liquid Chromatography Method
3.2. Development of Sample Extraction Methods
3.3. Validation of the Method
3.4. Determined Concentrations of Saponins in Food Ingredients, Half- and End-Products
4. Conclusions
Supplementary Materials
Author Contributions
Funding
Data Availability Statement
Acknowledgments
Conflicts of Interest
References
- Alexander, P.; Brown, C.; Arneth, A.; Finnigan, J.; Moran, D.; Rounsevell, M.D.A. Losses, inefficiencies and waste in the global food system. Agric. Syst. 2017, 153, 190–200. [Google Scholar] [CrossRef] [PubMed]
- FAO. Dietary Protein Quality Evaluation in Human Nutrition: Report of an FAO Expert Consultation, 31 March–2 April 2011, Auckland, New Zealand; FAO: Rome, Italy, 2013. [Google Scholar]
- Mäkinen, O.E.; Sozer, N.; Ercili-Cura, D.; Poutanen, K. Chapter 6—Protein From Oat: Structure, Processes, Functionality, and Nutrition. In Sustainable Protein Sources; Nadathur, S.R., Wanasundara, J.P.D., Scanlin, L., Eds.; Academic Press: San Diego, CA, USA, 2017; pp. 105–119. [Google Scholar]
- Tulbek, M.C.; Lam, R.S.H.; Wang, Y.C.; Asavajaru, P.; Lam, A. Chapter 9—Pea: A Sustainable Vegetable Protein Crop. In Sustainable Protein Sources; Nadathur, S.R., Wanasundara, J.P.D., Scanlin, L., Eds.; Academic Press: San Diego, CA, USA, 2017; pp. 145–164. [Google Scholar]
- Kaleda, A.; Talvistu, K.; Vaikma, H.; Tammik, M.-L.; Rosenvald, S.; Vilu, R. Physicochemical, textural, and sensorial properties of fibrous meat analogs from oat-pea protein blends extruded at different moistures, temperatures, and screw speeds. Future Foods 2021, 4, 100092. [Google Scholar] [CrossRef]
- Rackis, J.J.; Sessa, D.J.; Honig, D.H. Flavor problems of vegetable food proteins. J. Am. Oil Chem. Soc. 1979, 56, 262–271. [Google Scholar] [CrossRef]
- Rochfort, S.; Panozzo, J. Phytochemicals for health, the role of pulses. J. Agric. Food Chem. 2007, 55, 7981–7994. [Google Scholar] [CrossRef] [PubMed]
- Roland, W.S.U.; Pouvreau, L.; Curran, J.; van de Velde, F.; de Kok, P.M.T. Flavor Aspects of Pulse Ingredients. Cereal Chem. 2017, 94, 58–65. [Google Scholar] [CrossRef] [Green Version]
- Pecio, Ł.; Wawrzyniak-Szołkowska, A.; Oleszek, W.; Stochmal, A. Rapid analysis of avenacosides in grain and husks of oats by UPLC–TQ–MS. Food Chem. 2013, 141, 2300–2304. [Google Scholar] [CrossRef] [PubMed]
- Pecio, Ł.; Jędrejek, D.; Masullo, M.; Piacente, S.; Oleszek, W.; Stochmal, A. Revised structures of avenacosides A and B and a new sulfated saponin from Avena sativa L.: Steroidal saponins from Avena sativa L. Magn. Reason. Chem. 2012, 50, 755–758. [Google Scholar] [CrossRef]
- Önning, G.; Asp, N.-G. Analysis of saponins in oat kernels. Food Chem. 1993, 48, 301–305. [Google Scholar] [CrossRef]
- Günther-Jordanland, K.; Dawid, C.; Dietz, M.; Hofmann, T. Key Phytochemicals Contributing to the Bitter Off-Taste of Oat (Avena sativa L.). J. Agric. Food Chem. 2016, 64, 9639–9652. [Google Scholar] [CrossRef] [PubMed]
- Günther-Jordanland, K.; Dawid, C.; Hofmann, T. Quantitation and Taste Contribution of Sensory Active Molecules in Oat (Avena sativa L.). J. Agric. Food Chem. 2020, 68, 10097–10108. [Google Scholar] [CrossRef] [PubMed]
- Price, K.R.; Fenwick, G.R. Soyasaponin I, a compound possessing undesirable taste characteristics isolated from the dried pea (Pisum sativum L.). J. Sci. Food Agric. 1984, 35, 887–892. [Google Scholar] [CrossRef]
- Price, K.R.; Johnson, I.T.; Fenwick, G.R.; Malinow, M.R. The chemistry and biological significance of saponins in foods and feedingstuffs. Crit. Rev. Food Sci. Nutr. 1987, 26, 27–135. [Google Scholar] [CrossRef] [PubMed]
- Lásztity, R.; Hidvégi, M.; Bata, Á. Saponins in food. Food Rev. Int. 1998, 14, 371–390. [Google Scholar] [CrossRef]
- Yang, J.; Wang, P.; Wu, W.; Zhao, Y.; Idehen, E.; Sang, S. Steroidal Saponins in Oat Bran. J. Agric. Food Chem. 2016, 64, 1549–1556. [Google Scholar] [CrossRef] [PubMed]
- Heng, L.; Vincken, J.-P.; Hoppe, K.; van Koningsveld, G.A.; Decroos, K.; Gruppen, H.; van Boekel, M.A.J.S.; Voragen, A.G.J. Stability of pea DDMP saponin and the mechanism of its decomposition. Food Chem. 2006, 99, 326–334. [Google Scholar] [CrossRef]
- Heng, L.; Vincken, J.-P.; van Koningsveld, G.; Legger, A.; Gruppen, H.; van Boekel, T.; Roozen, J.; Voragen, F. Bitterness of saponins and their content in dry peas. J. Sci. Food Agric. 2006, 86, 1225–1231. [Google Scholar] [CrossRef]
- Cheeke, P.R. Nutritional and physiological implications of saponins: A review. Can. J. Anim. Sci. 1971, 51, 621–632. [Google Scholar] [CrossRef]
- Southon, S.; Wright, A.J.; Price, K.R.; Fairweather-Tait, S.J.; Fenwick, G.R. The effect of three types of saponin on iron and zinc absorption from a single meal in the rat. Br. J. Nutr. 1988, 59, 389–396. [Google Scholar] [CrossRef]
- Ikewuchi, C.C. Hypocholesterolemic effect of an aqueous extract of the leaves of Sansevieria senegambica Baker on plasma lipid profile and atherogenic indices of rats fed egg yolk supplemented diet. EXCLI J. 2012, 11, 346–356. [Google Scholar]
- Barky, A.R.E.; Hussein, S.A.; Alm-Eldeen, A.-E.; Hafez, Y.A.; Mohamed, T.M. Saponins and their potential role in diabetes mellitus. Diabetes Manag. 2017, 7, 148. [Google Scholar]
- Johnson, I.T.; Gee, J.M.; Price, K.; Curl, C.; Fenwick, G.R. Influence of Saponins on Gut Permeability and Active Nutrient Transport in Vitro. J. Nutr. 1986, 116, 2270–2277. [Google Scholar] [CrossRef] [PubMed]
- Yamamoto, M.; Kumagai, A.; Yamamura, Y. Plasma lipid-lowering action of ginseng saponins and mechanism of the action. Am. J. Chin. Med. 1983, 11, 84–87. [Google Scholar] [CrossRef] [PubMed]
- Dong, J.; Liang, W.; Wang, T.; Sui, J.; Wang, J.; Deng, Z.; Chen, D. Saponins regulate intestinal inflammation in colon cancer and IBD. Pharmacol. Res. 2019, 144, 66–72. [Google Scholar] [CrossRef] [PubMed]
- Van Atta, G.R.; Guggolz, J.; Thompson, C.R. Plant Analysis, Determination of Saponins in Alfalfa. J. Agric. Food Chem. 1961, 9, 77–79. [Google Scholar] [CrossRef]
- Von Buchi, J.; Dolder, R. Determining the hemolytic index of official medicinal drugs. Pharm. Acta Helv. 1950, 25, 179–188. [Google Scholar] [PubMed]
- Morgan, M.R.A.; McNerney, R.; Matthew, J.A.; Coxon, D.T.; Chan, H.W.-S. An enzyme-linked immunosorbent assay for total glycoalkaloids in potato tubers. J. Sci. Food Agric. 1983, 34, 593–598. [Google Scholar] [CrossRef]
- Thieme, H.; Hartmann, U. Comparison of various methods for the spectrophotometric determination of glycyrrhizic acid in Radix liquiritiae DAB 7-DDR. Pharm 1974, 29, 50–53. [Google Scholar]
- Fenwick, D.E.; Oakenfull, D. Saponin content of soya beans and some commercial soya bean products. J. Sci. Food Agric. 1981, 32, 273–278. [Google Scholar] [CrossRef]
- Reim, V.; Rohn, S. Characterization of saponins in peas (Pisum sativum L.) by HPTLC coupled to mass spectrometry and a hemolysis assay. Food Res. Int. 2015, 76, 3–10. [Google Scholar] [CrossRef]
- Myoga, K.; Shibata, F. Ladino Clover Sapogenins and the Gas Chromatographic Assay Method. Jpn. Soc. Grassl. Sci. 1977, 23, 67–72. [Google Scholar]
- Kesselmeier, J.; Strack, D. High Performance Liquid Chromatographic Analysis of Steroidal Saponins from Avena sativa L. Z. Nat. C 1981, 36, 1072–1074. [Google Scholar] [CrossRef]
- Amarowicz, R.; Yoshiki, Y.; Pegg, R.B.; Okubo, K. Presence of two saponins in faba bean (Vicia faba L.) seeds. Food Nahr. 1997, 41, 352–354. [Google Scholar] [CrossRef]
- Maillard, M.P.; Wolfender, J.-L.; Hostettmann, K. Use of liquid chromatography—Thermospray mass spectrometry in phytochemical analysis of crude plant extracts. J. Chromatogr. A 1993, 647, 147–154. [Google Scholar] [CrossRef]
- Wolfender, J.L.; Hostettmann, K.; Abe, F.; Nagao, T.; Okabe, H.; Yamauchi, T. Liquid chromatography combined with thermospray and continuous-flow fast atom bombardment mass spectrometry of glycosides in crude plant extracts. J. Chromatogr. A 1995, 712, 155–168. [Google Scholar] [CrossRef] [PubMed]
- Decroo, C.; Colson, E.; Lemaur, V.; Caulier, G.; De Winter, J.; Cabrera-Barjas, G.; Cornil, J.; Flammang, P.; Gerbaux, P. Ion mobility mass spectrometry of saponin ions. Rapid Commun. Mass Spectrom. 2019, 33, 22–33. [Google Scholar] [CrossRef] [Green Version]
- Decroos, K.; Vincken, J.-P.; Heng, L.; Bakker, R.; Gruppen, H.; Verstraete, W. Simultaneous quantification of differently glycosylated, acetylated, and 2,3-dihydro-2,5-dihydroxy-6-methyl-4H-pyran-4-one-conjugated soyasaponins using reversed-phase high-performance liquid chromatography with evaporative light scattering detection. J. Chromatogr. A 2005, 1072, 185–193. [Google Scholar] [CrossRef]
- Tian, J.; Fu, C.; Xu, L.; Lu, M. Extraction and identification of group B soybean saponins based on adsorption chromatography and HPLC-MS. In Proceedings of the 2010 3rd International Conference on Biomedical Engineering and Informatics, Yantai, China, 16–18 October 2010; pp. 2049–2051. [Google Scholar]
- Kaleda, A.; Talvistu, K.; Tamm, M.; Viirma, M.; Rosend, J.; Tanilas, K.; Kriisa, M.; Part, N.; Tammik, M.-L. Impact of Fermentation and Phytase Treatment of Pea-Oat Protein Blend on Physicochemical, Sensory, and Nutritional Properties of Extruded Meat Analogs. Foods 2020, 9, 1059. [Google Scholar] [CrossRef]
- Kruve, A.; Rebane, R.; Kipper, K.; Oldekop, M.-L.; Evard, H.; Herodes, K.; Ravio, P.; Leito, I. Tutorial review on validation of liquid chromatography–mass spectrometry methods: Part II. Anal. Chim. Acta 2015, 870, 8–28. [Google Scholar] [CrossRef]
- Guidelines for Standard Method Performance Requirements AOAC. Appendix F. 2016, p. 18. Available online: https://www.aoac.org/wp-content/uploads/2019/08/app_f.pdf (accessed on 14 April 2022).
- Biotage ISOLUTE® PLD+. Available online: https://www.biotage.com/phospholipid-removal (accessed on 15 January 2023).
- Hu, J.; Lee, S.-O.; Hendrich, S.; Murphy, P.A. Quantification of the Group B Soyasaponins by High-Performance Liquid Chromatography. J. Agric. Food Chem. 2002, 50, 2587–2594. [Google Scholar] [CrossRef] [Green Version]
- Guidelines for the Validation of Chemical Methods for the FDA FVM Program, 3rd ed.; U.S. Food and Drug Administration Foods Program: White Oak, MD, USA, 2019. Available online: https://www.fda.gov/media/81810/download (accessed on 31 March 2022).
- Grant, R.P.; Rappold, B.A. Development and Validation of Small Molecule Analytes by Liquid Chromatography-Tandem Mass Spectrometry. In Principles and Applications of Clinical Mass Spectrometry, 1st ed.; Rifai Horvath, A.R., Wittwer, C.T., Eds.; Elsevier: London, UK, 2018; pp. 115–179. [Google Scholar] [CrossRef]


| Sample Extraction 1A | Modified Sample Extraction 1B | Sample Extraction 2A | Modified Sample Extraction 2B | Modified Sample Extraction 2C | Modified Sample Extraction 2D | |
|---|---|---|---|---|---|---|
| Defatted sample | yes | yes | yes | yes | no | no |
| Sample and solvent amount (10 g/L) | 0.5 g, 25 mL × 2 MeOH | 0.5 g, 25 mL × 2 MeOH | 0.5 g, 50 mL EtOH (70%, v/v) | 0.1 g, 10 mL EtOH (70%, v/v) | 0.1 g, 10 mL EtOH (70%, v/v) | 0.1 g, 10 mL EtOH (70%, v/v) |
| Extraction | 2-step reflux at boiling point | 2-step reflux at boiling point | 1 h at 25 °C in a shaking incubator | 1 h at 25 °C in a shaking incubator | 1 h at 25 °C in a shaking incubator | 30 min ultrasonic bath |
| Clean-up | decant | centrifuge (17,000× g × 10 min at 10 °C) | ashless filter paper | centrifuge (17,000× g × 10 min at 10 °C) | centrifuge (14,000× g × 10 min at 10 °C) | centrifuge (14,000× g × 10 min at 10 °C) |
| Solvent evaporation | vacuum rotary evaporator | - | vacuum rotary evaporator | - | - | - |
| Resuspended | an aqueous MeOH (5%, v/v) | - | - | - | - | - |
| Centrifuge | 17,000× g × 10 min at 10 °C | - | 17,000× g × 10 min at 10 °C | - | - | - |
| Sample clean-up and concentration | SPE C18 | - | SPE C18 | - | - | - |
| Solvent evaporation | N2 flow | - | N2 flow | - | - | - |
| Filtering | - | - | - | - | PLD+ column | PLD+ column |
| Reconstitution/dilution in an aqueous MeCN (50%, v/v) | yes | yes | yes | yes | yes | yes |
| Obtained results (mg/100 g ± SD) | ||||||
| Avenacoside A b | 19 ± 2 c | 26 ± 1 c | 18 ± 3 c | 37 ± 2 c | 36 ± 3 | 37 ± 2 |
| Saponin B d | 100 ± 3 c | 214 ± 5 c | 124 ± 10 c | 219 ± 8 c | 229 ± 22 | 240 ± 19 |
| Analyte | Linear Range (mg/L) | Calibration Curve 1 | R2 | LOD (mg/L) | LOQ (mg/L) |
|---|---|---|---|---|---|
| avenacoside A | 0.01–2.44 | y = 0.2445x − 0.0197 | 0.9998 | 0.004 | 0.015 |
| saponin B | 0.01–2.48 | y = 0.6350x − 0.0059 | 0.9999 | 0.004 | 0.014 |
| Analyte | m/z | RT, min | RT RSD (%) | Peak Area RSD (%) | Precision RSD (%) | |||||
|---|---|---|---|---|---|---|---|---|---|---|
| Intra-Day (n = 6) | Inter-Day (n = 18) | Intra-day (n = 6) | Inter-Day (n = 18) | Powdered Samples | Plant-Based Drinks | |||||
| Intra-Day (n = 6) | Inter-Day (n = 9) | Intra-Day (n = 6) | Inter-Day (n = 9) | |||||||
| Avenacoside A | 1061.5 | 1.78 | 0.23 a | 0.48 a | 1.8 a | 3.0 a | 11 | 11 | 12 | 12 |
| Avenacoside B | 1223 | 1.93 | 0.20 a | 0.27 a | 4.1 a | 4.5 a | 13 | 9 | 3 | 8 |
| 26-desglucoavenacoside A | 899.5 | 1.54 | 0.36 a | 0.56 a | 3.8 a | 6.0 a | 6 | 7 | 10 | 16 |
| 13C-avenacoside A b | 1112.5 | 1.78 | 0.28 | 0.54 | 2.9 | 4.2 | n.i. | n.i. | n.i. | n.i. |
| Saponin B | 941.5 | 1.42 | 0.29 c | 0.98 c | 2.6 c | 3.1 c | 6 | 7 | 6 | 7 |
| DDMP saponin | 1067 | 1.40 | 0.23 c | 0.86 c | 3.9 c | 6.3 c | 8 | 11 | n.a. | n.a. |
| Soyasaponin Ba d | 957.5 | 1.48 | 0.30 | 0.68 | 2.5 | 3.0 | n.i. | n.i. | n.i. | n.i. |
| Spiking Level | Spike (mg/L) | Recovery (%) | Spike (mg/L) | Recovery (%) | Recovery (%) | |
|---|---|---|---|---|---|---|
| Oat Protein Concentrate 2 | Oat Drink 3 | Pea Drink 4 | ||||
| Avenacoside A | L1 | 1.2 | 115 ± 7 | 0.24 | 104 ± 6 | 106 ± 1 |
| L2 | 0.9 | 90 ± 7 | 0.12 | 113 ± 7 | 99 ± 3 | |
| L3 | 0.4 | 107 ± 12 | 0.06 | 96 ± 13 | 94 ± 1 | |
| Pea protein isolate 5 | Oat drink 4 | Pea drink 6 | ||||
| Saponin B | L1 | 1.1 | 82 ± 2 | 0.23 | 105 ± 2 | 98 ± 5 |
| L2 | 0.5 | 100 ± 1 | 0.11 | 113 ± 8 | 89 ± 2 | |
| L3 | 0.3 | 96 ± 10 | 0.06 | 98 ± 15 | 93 ± 6 |
| mg/100 g | |||||
|---|---|---|---|---|---|
| Sample | Avenacoside A | Avenacoside B 2 | 26-desglucoavenacoside A 2 | Saponin B | DDMP Saponin 3 |
| Oat protein concentrate | 42.3 ± 3.0 | 33.8 ± 0.7 | 5.1 ± 0.2 | n.a. | n.a. |
| Whole-grain oat flour | 23.4 ± 2.9 | 14.0 ± 1.5 | <LOQ | n.a. | n.a. |
| Oat drink | 4.6 ± 0.1 | 2.7 ± 0.2 | <LOQ | n.a. | n.a. |
| Pea protein isolate | n.a. | n.a. | n.a. | 243.8 ± 6.2 | 10.8 ± 0.7 |
| Pea protein concentrate | n.a. | n.a. | n.a. | 20.3 ± 1.6 | 107.6 ± 4.1 |
| Pea flour | n.a. | n.a. | n.a. | 6.2 ± 0.4 | 61.1 ± 2.0 |
| Pea drink | n.a. | n.a. | n.a. | 3.5 ± 0.2 | <LOQ |
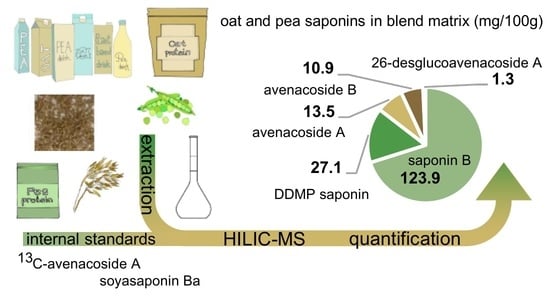
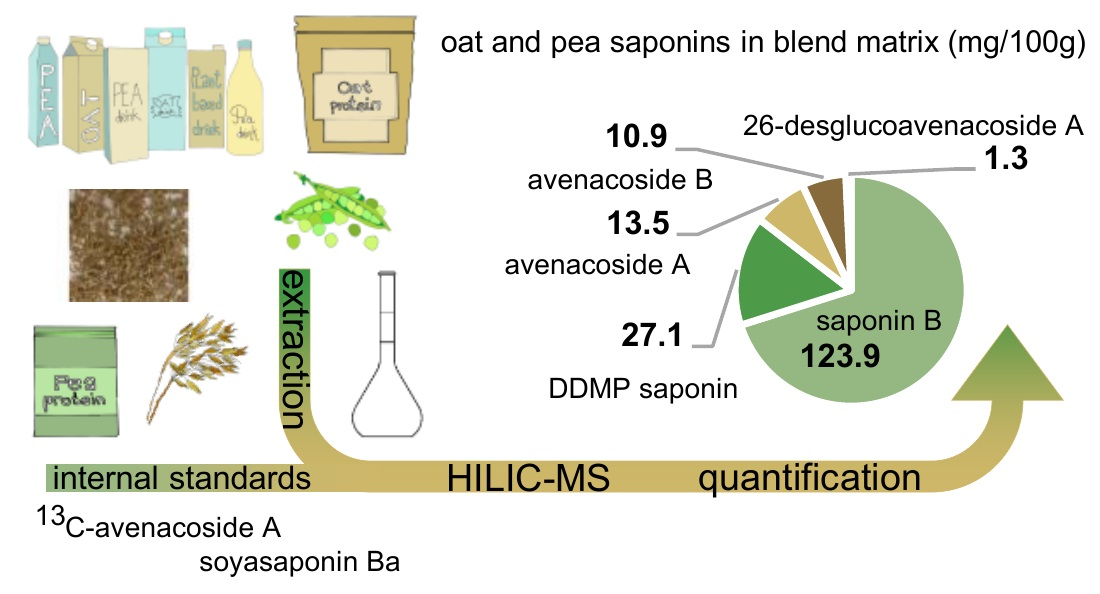
| Blend 4 | 13.5 ± 1.0 | 10.9 ± 0.3 | 1.3 ± 0.3 | 123.9 ± 6.3 | 27.1 ± 3.5 |
| Extruded blend 4 | 10.6 ± 0.3 | 9.6 ± 0.9 | 1.1 ± 0.9 | 132.9 ± 12.4 | 11.4 ± 0.8 |
Disclaimer/Publisher’s Note: The statements, opinions and data contained in all publications are solely those of the individual author(s) and contributor(s) and not of MDPI and/or the editor(s). MDPI and/or the editor(s) disclaim responsibility for any injury to people or property resulting from any ideas, methods, instructions or products referred to in the content. |
© 2023 by the authors. Licensee MDPI, Basel, Switzerland. This article is an open access article distributed under the terms and conditions of the Creative Commons Attribution (CC BY) license (https://creativecommons.org/licenses/by/4.0/).
Share and Cite
Bljahhina, A.; Pismennõi, D.; Kriščiunaite, T.; Kuhtinskaja, M.; Kobrin, E.-G. Quantitative Analysis of Oat (Avena sativa L.) and Pea (Pisum sativum L.) Saponins in Plant-Based Food Products by Hydrophilic Interaction Liquid Chromatography Coupled with Mass Spectrometry. Foods 2023, 12, 991. https://doi.org/10.3390/foods12050991
Bljahhina A, Pismennõi D, Kriščiunaite T, Kuhtinskaja M, Kobrin E-G. Quantitative Analysis of Oat (Avena sativa L.) and Pea (Pisum sativum L.) Saponins in Plant-Based Food Products by Hydrophilic Interaction Liquid Chromatography Coupled with Mass Spectrometry. Foods. 2023; 12(5):991. https://doi.org/10.3390/foods12050991
Chicago/Turabian StyleBljahhina, Anastassia, Dmitri Pismennõi, Tiina Kriščiunaite, Maria Kuhtinskaja, and Eeva-Gerda Kobrin. 2023. "Quantitative Analysis of Oat (Avena sativa L.) and Pea (Pisum sativum L.) Saponins in Plant-Based Food Products by Hydrophilic Interaction Liquid Chromatography Coupled with Mass Spectrometry" Foods 12, no. 5: 991. https://doi.org/10.3390/foods12050991